Charts
Charts offer a visual reporting option for which you may tailor to get a comprehensive overview for a selection of contracts.
There are 5 categories of charts, within each is a number of reporting options;
- Communications/behaviours
- Cost
- Quality
- Risk
- Time
Video content is available below.
Firstly, within Analytics open the left-hand expandable menu and select Charts: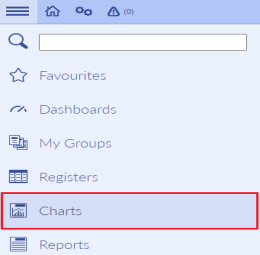
You will then be presented with a menu of the chart categories: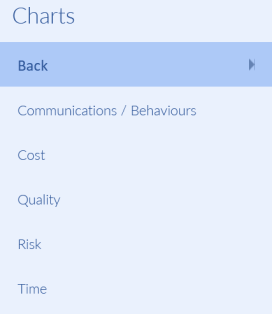
Once you have selected a category, you’ll then be directed to the Charts area: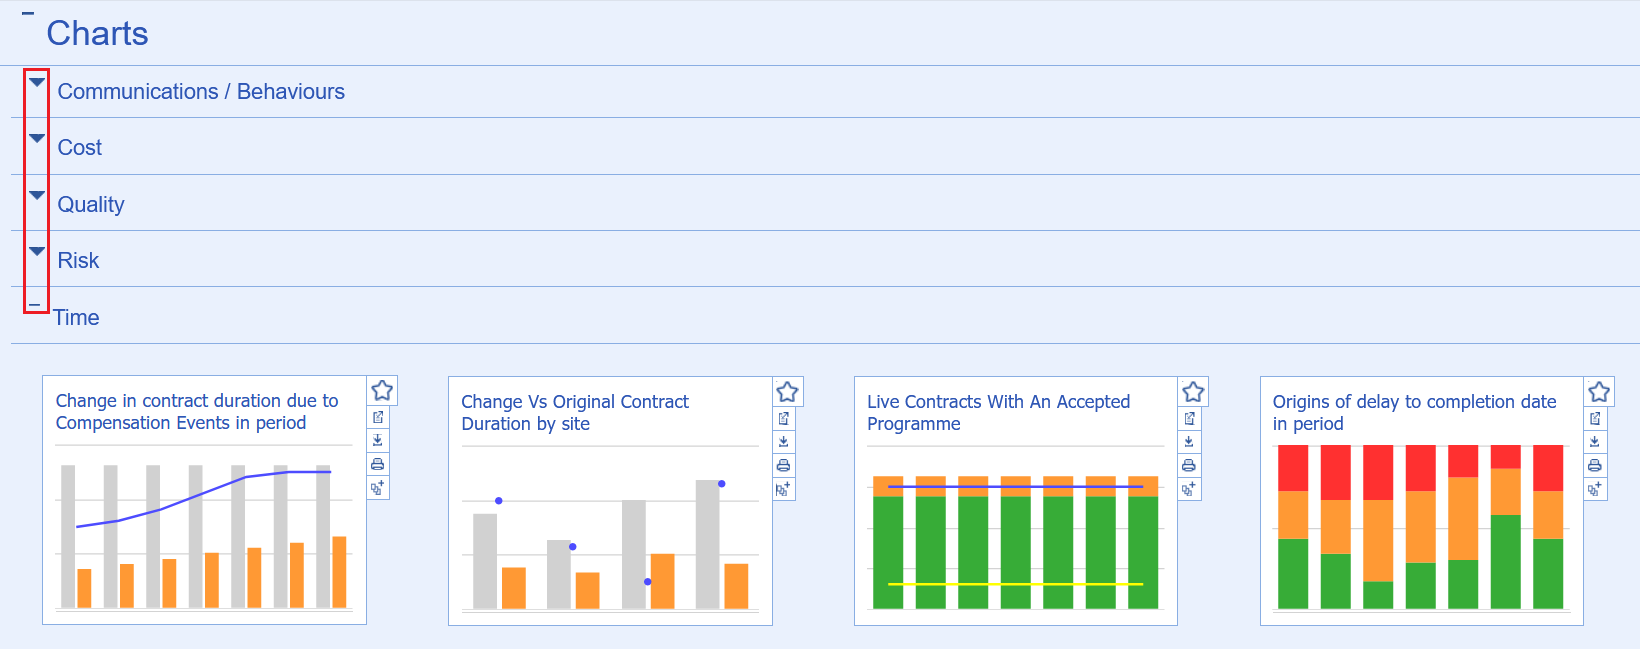
By selecting the icons to the left of each category, you may expand or minimise each of the sub-sections.
There are several icons located to the right of each chart:![]()
![]() - Add this chart to your favourites – this is an area for all your favourite charts and reports which can be accessed via the left-hand expandable menu
- Add this chart to your favourites – this is an area for all your favourite charts and reports which can be accessed via the left-hand expandable menu
![]() - This will open the chart preview
- This will open the chart preview
![]() - Download/export this chart in a choice of a range of formats
- Download/export this chart in a choice of a range of formats
![]() - Print this chart
- Print this chart
![]() - Add to group - more information can be found on our help article on groups here
- Add to group - more information can be found on our help article on groups here
Once you have opened a chart, you will be presented with a number of filter options on the left-hand side to manipulate the data shown: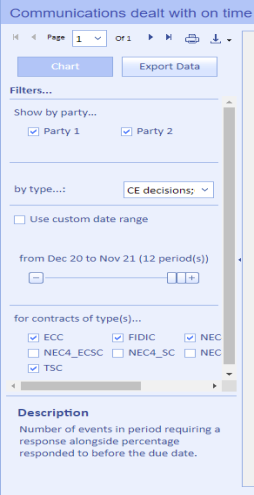
You may choose to view the previous periods' data, display data on one or both parties, use a custom date range and select which type of contracts you wish to report on.
If you wish to export the chart, click on the download icon and select your chosen format, highlighted below: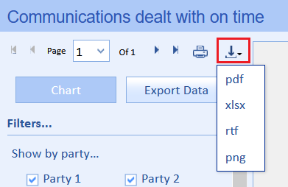
Certain charts have a dedicated Export Data button which will automatically transfer the chart into .xlsx format.